Sequence Visualization in Plasmid Design Tools
Sequence visualization in plasmid design tools connects bases, features, topology, and design changes across multiple views. Each view answers a different review question.
Molecular biologists use maps to orient themselves, sequence views to inspect exact edits, and alignments to compare expected and observed constructs. Software is most useful when these views reinforce one another instead of presenting disconnected pictures.
Why a Plasmid Map Alone Is Not Enough
A circular plasmid map summarizes feature order and orientation, which makes it useful for communicating an overall construct. It can also hide short junctions, reading-frame changes, primer-derived bases, or overlapping annotations. These details become visible only at sequence level.
Reviewers should be able to select a feature on the map and see its exact coordinates, strand, sequence, and neighboring elements. When a design operation changes the construct, the software should make the change visible in both graphical and base-level views.
Visualization Should Support Decisions, Not Decoration
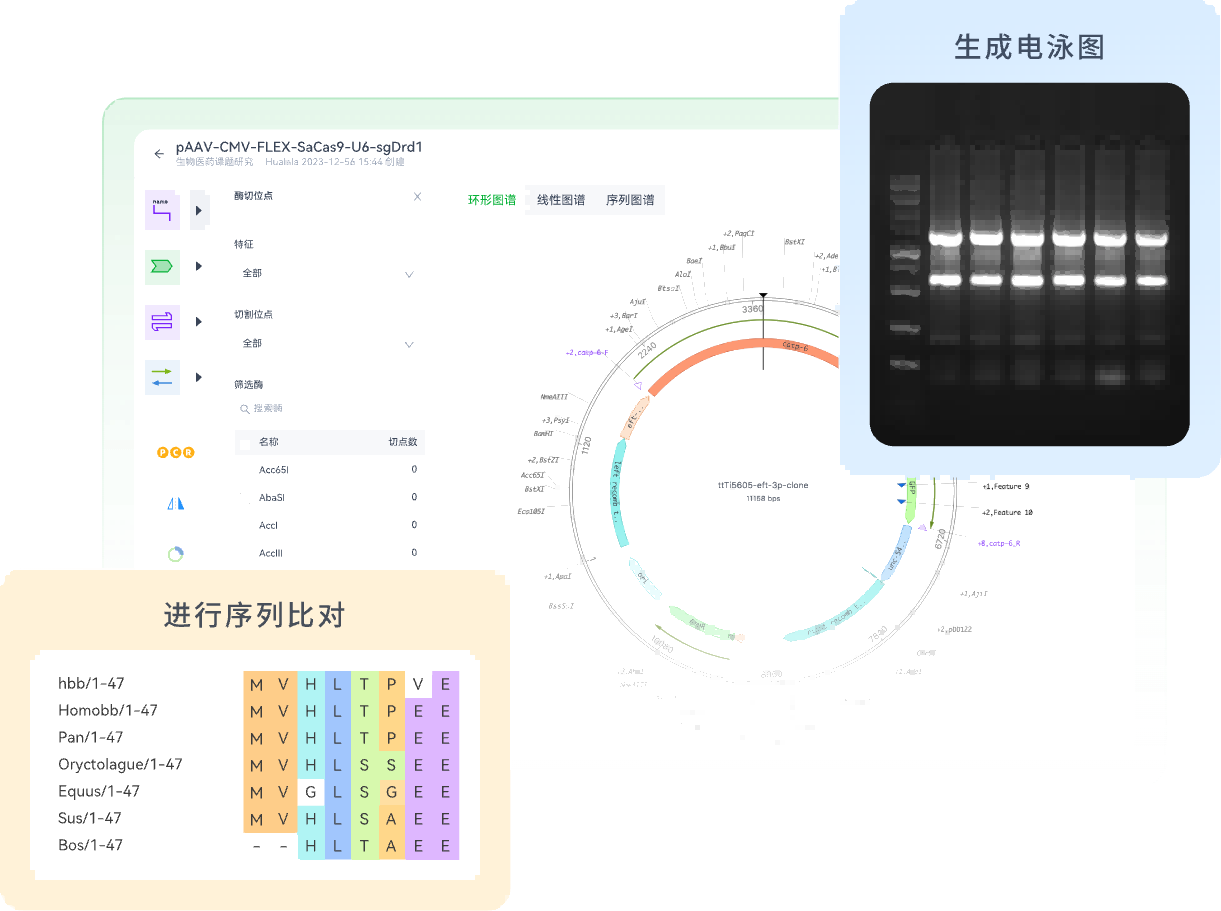
Colorful maps are not automatically informative. Feature colors, label density, and track layout should help a researcher distinguish regulatory elements, coding sequences, primers, cloning junctions, and restriction sites. If every feature competes for attention, the visualization can make review slower rather than clearer.
Circular, Linear, and Sequence Views Serve Different Tasks
| View | Primary Use | Common Limitation |
|---|---|---|
| Circular map | Topology, feature order, orientation, and communication | Short junction details can be hidden |
| Linear map | Comparing boundaries, insert direction, and multipart structure | Whole-plasmid context may require scrolling |
| Base sequence | Reading frames, exact edits, primer sites, and overhangs | Harder to understand global organization |
| Restriction map | Unique sites, fragment planning, and diagnostic digest logic | Does not predict experimental enzyme performance |
| Alignment view | Comparing expected constructs with references or sequencing data | Interpretation depends on sequence quality and coverage |
Feature Annotations Need Coordinates and Meaning
Annotations should record more than a feature name. Useful records include coordinates, strand orientation, feature type, qualifiers, and a clear source or rationale. For coding sequences, reviewers may also need translation context and reading-frame continuity. For primers, they need binding location and direction.
ZettaGene supports sequence visualization and annotation within the Zettalab molecular biology workspace. Its value is strongest when a team uses the same feature context during plasmid construction, primer design, alignment, and later review.
Shared Libraries Require Consistent Boundaries
A shared feature library can reduce repeated annotation, but only when the underlying definitions are governed. Teams should confirm that a reused feature matches the actual sequence and boundaries in the current construct. Names alone are insufficient, particularly when similar promoters, tags, or selection markers exist in multiple variants.
Restriction Sites Need Contextual Filtering
Showing every possible restriction site can overwhelm a map. Researchers usually need filters for unique cutters, enzymes relevant to the planned assembly, sites within a selected region, or enzymes excluded by methylation and protocol constraints. Visualization should narrow the review question without hiding the underlying sequence.
A restriction map remains a planning aid. Researchers must still verify enzyme requirements, buffer compatibility, expected fragment sizes, and current supplier documentation before running an experiment. The Zettalab molecular biology guides can support the software-planning layer of this workflow.
Use Alignment Views to Close the Design Loop
Visualization becomes more valuable after bench work when sequencing results are compared with the expected construct. An alignment can reveal substitutions, deletions, insertions, or incomplete coverage, but the reviewer must distinguish true sequence differences from low-quality reads or alignment artifacts.
The expected design version should be recorded alongside the verification evidence. Otherwise, a clean alignment against an outdated reference can create false confidence. Teams should connect the final map, reference sequence, alignment result, and experiment conclusion in one project context.
Evaluate Visualization with Real Lab Files
A practical software trial should include a small plasmid, a feature-dense expression construct, and a design with overlapping or reverse-strand annotations. Reviewers should test whether labels remain readable, selections persist between views, and imports preserve topology and features.
They should also test export because maps often appear in protocols, presentations, publications, or partner handoffs. Researchers who need local access can review the ZettaGene download options while evaluating how desktop and shared workflows fit their environment.
FAQ
What is the most useful view for plasmid design?
No single view is sufficient. A circular map is useful for overall topology and feature order, a linear view helps compare boundaries and orientation, and a base-level sequence view is necessary for exact junctions and reading frames. Restriction and alignment views answer additional planning and verification questions. The most useful software keeps selections synchronized across views so researchers can move from the overall construct to an exact sequence detail without losing which feature or edit they are reviewing.
How should plasmid features be displayed?
Features should be displayed with clear names, boundaries, strand direction, and distinguishable types. Labels should remain readable without obscuring neighboring elements, and users should be able to hide or filter low-priority annotations. Selecting a feature should reveal its coordinates, sequence, qualifiers, and source context. For team use, naming and color conventions should be consistent enough that two researchers interpret the map in the same way. Visual consistency supports communication, but it does not replace sequence confirmation.
Why do circular and linear plasmid maps sometimes look different?
The two views organize the same sequence differently. A circular map emphasizes topology and wraps the origin to the end, while a linear map shows the sequence as a continuous left-to-right interval. Labels may be placed differently to avoid overlap, and a feature crossing the coordinate origin can appear split in a linear view. Researchers should check coordinates and sequence rather than assuming a graphical difference represents a biological change. Good software keeps feature identity consistent across both views.
Can plasmid visualization software verify a cloned construct?
Visualization software can support verification by aligning sequencing results with the expected plasmid and highlighting sequence differences. It cannot establish that the physical sample is correct without suitable experimental evidence and adequate sequence coverage. Researchers should review read quality, coverage across critical regions, junctions, and any discrepancies. The final conclusion should connect the expected design version with the raw sequencing files, alignment output, and laboratory record so another reviewer can reconstruct the decision.
What should teams test when comparing plasmid map tools?
Teams should test import fidelity, circular and linear navigation, feature visibility, annotation editing, restriction-site filtering, sequence-level selection, alignment review, and export quality. They should use real feature-dense files rather than a simple demonstration plasmid. Collaboration tests should cover permissions, authoritative versions, comments, and whether a map can be referenced from experiment records. The goal is to determine whether visualization helps the team make and review decisions, not merely whether the exported figure looks polished.
Conclusion
Effective plasmid visualization connects map-level understanding with exact sequence evidence. Circular, linear, restriction, and alignment views should help researchers review different parts of the same design story. Explore ZettaGene sequence visualization tools to assess how these views support your plasmid workflow.
Related Articles